System Dashboard
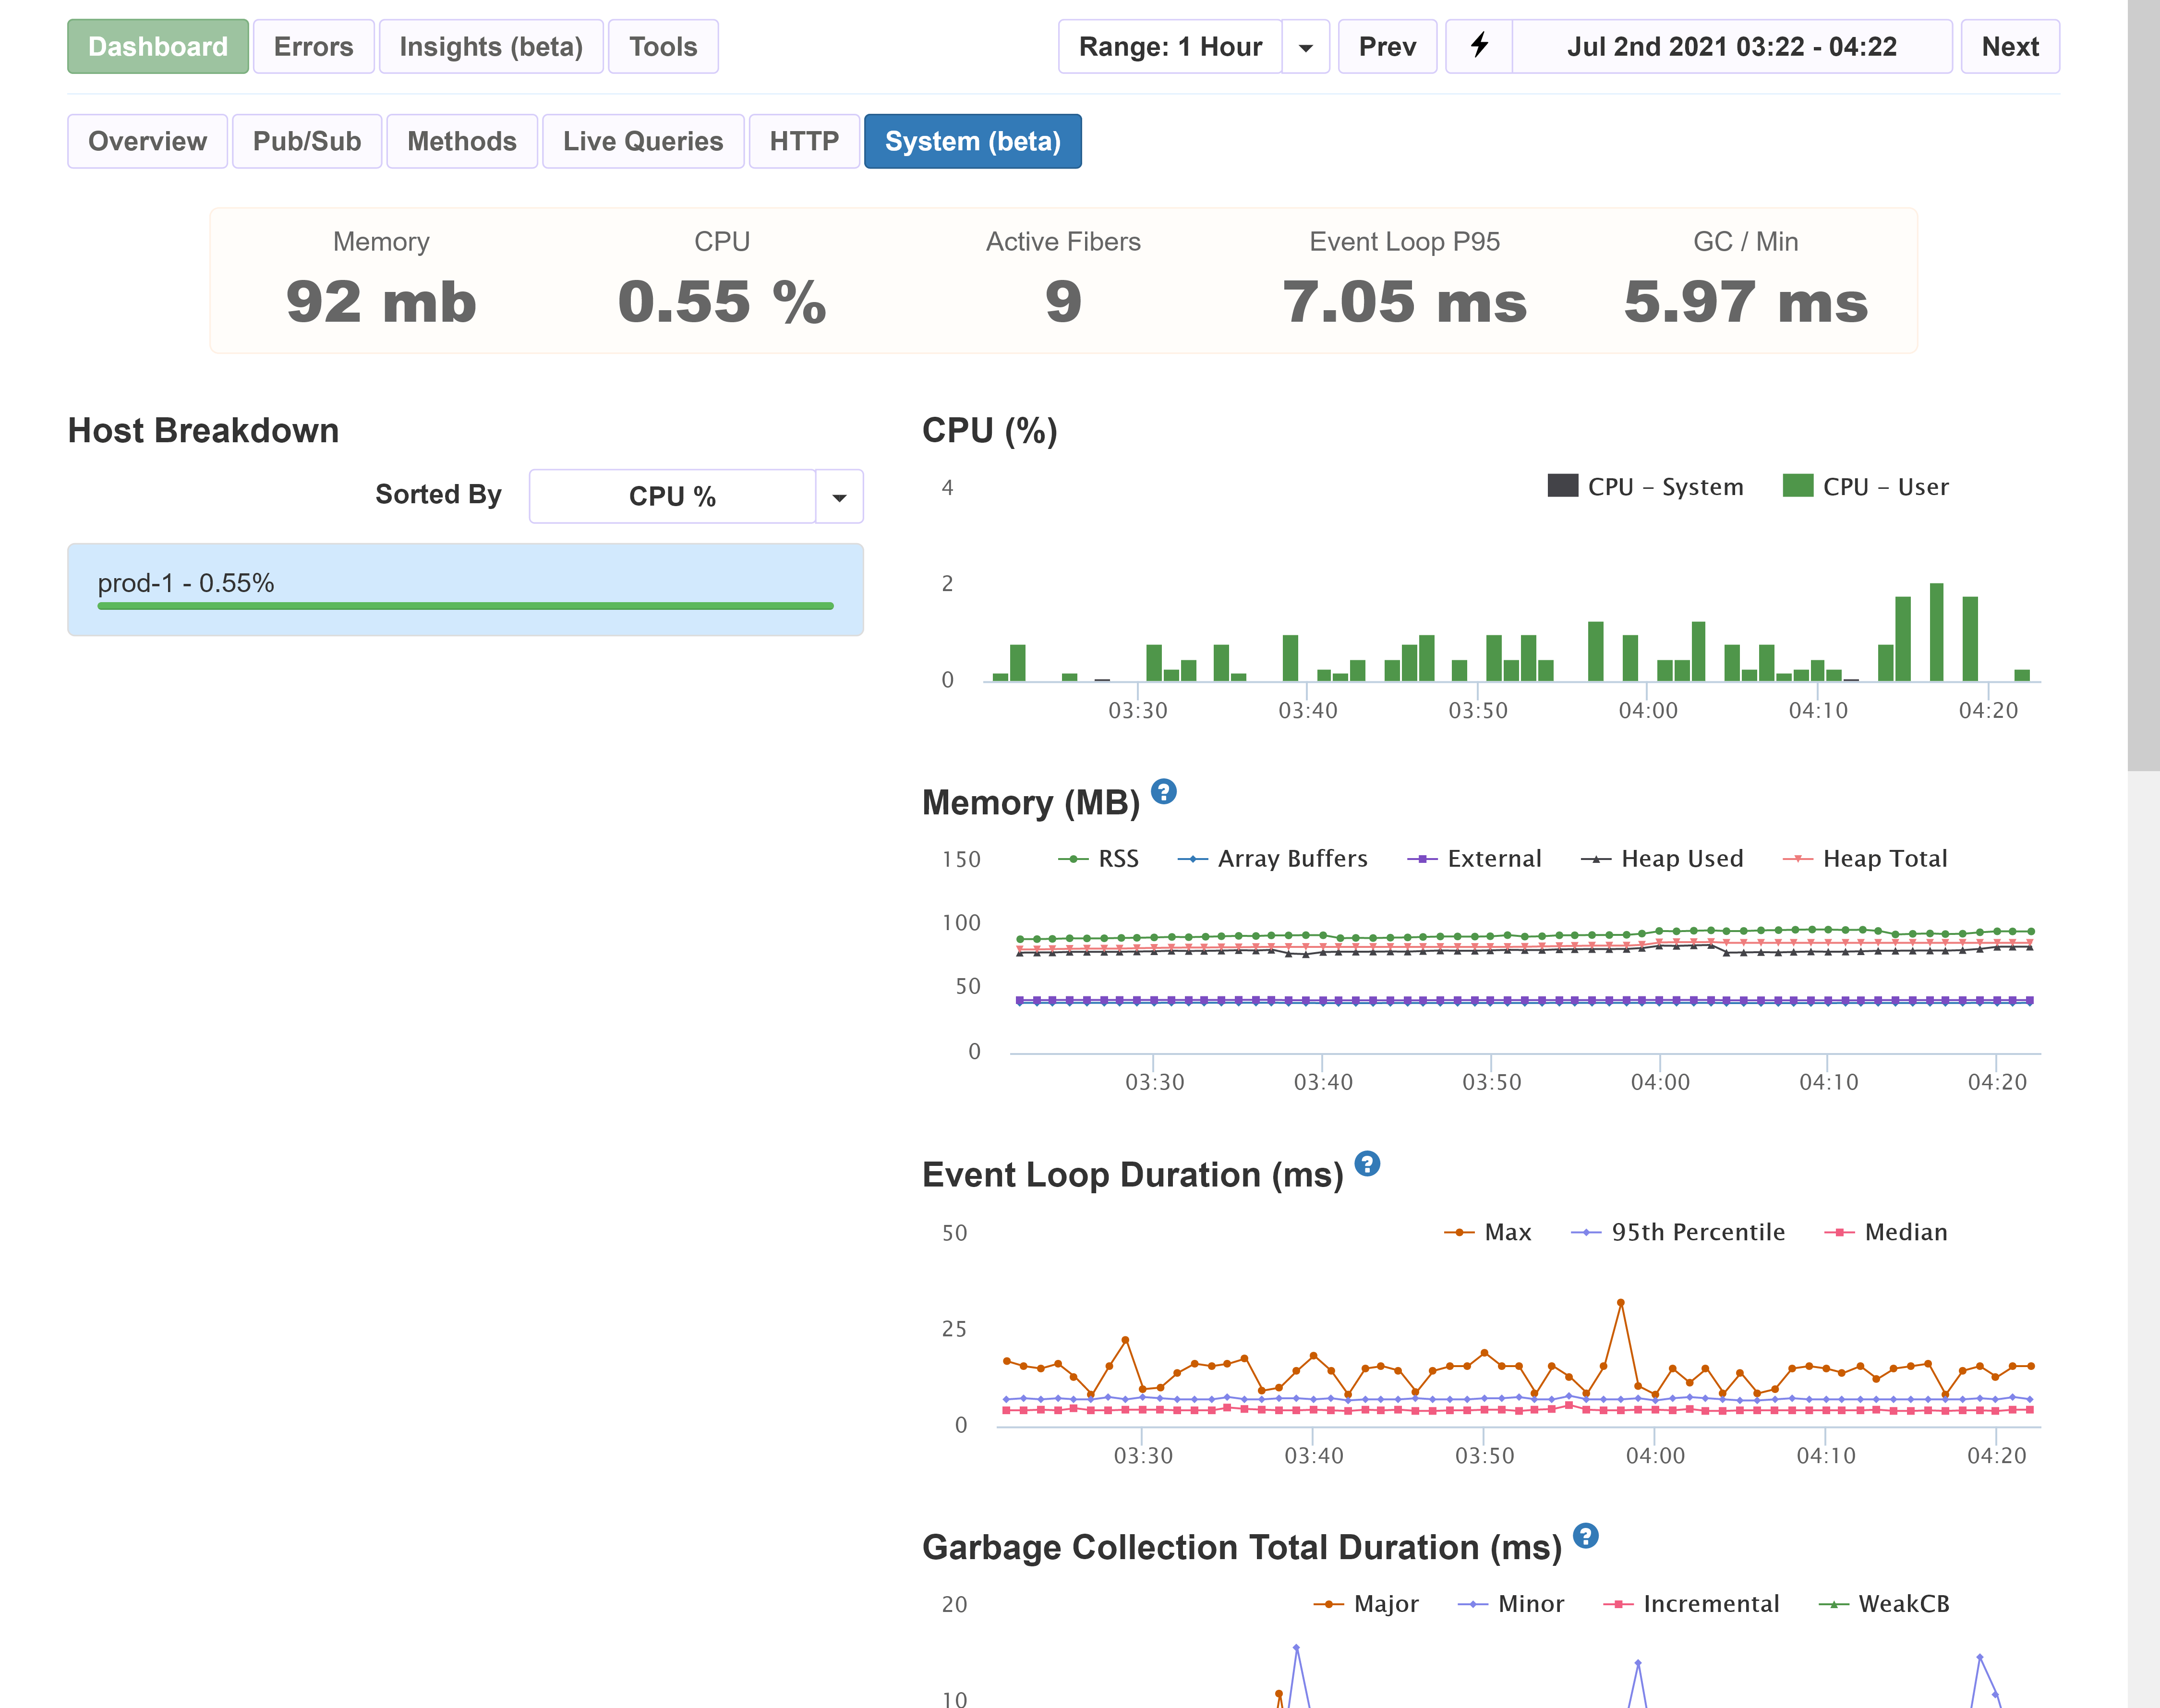
The system dashboard shows you what is happening inside the Node.js servers.
This feature is currently in beta
Many of the metrics requires version 2.44.0 or newer of the montiapm:agent package. To update, run:
meteor update montiapm:agentMemory
The Memory chart shows a breakdown of what is using memory in the Node server.
- RSS is the amount of physical memory used by Node
- Heap Total is the memory used by the heap in v8 to store objects, variables in closures, large numbers, etc. Taking a heap snapshot shows what is in the heap.
- Heap Used is the amount of the heap that is actually used.
- Array Buffers is the memory used by Node Buffers, ArrayBuffers, and sharedArrayBuffers.
- External is memory used by c++ objects bound to js objects.
Event Loop Latency
The event loop handles running timers, callbacks, event listeners, and other async code in JavaScript. The latency can become large when code uses sync version of api's, when javascript oce runs for a long time, or there are many events the event loop needs to handle.
Usually you should try to keep it below 100ms.
The agent samples the latency once every 20ms. The numbers shown on the chart are based on the samples. There could be times the latency is higher than the max shown if it wasn't in one of the samples.
To learn more about the event loop, you can read the event loop in Node.js's docs.
Garbage Collection
Garbage Collection (GC) is the process no longer used memory is freed in JavaScript.
While GC is running, it can block javascript from running. If the server has multiple cores,
parts of GC can run in parallel with javascript.
There are multiple types of garbage collection:
- Minor - a fast GC that runs often to free up recently used memory, and can run in parallel with JS.
- Major - Cleans up old memory that is no longer used. JS is unable to run during Major GC.
- Incremental - similar to Major, except it breaks the work apart to block for shorter periods of time in exchange for blocking more times.
Monitoring garbage collection requires Meteor 1.6 or newer. If your app uses an older version of Meteor, the metrics will all be set to 0.
Fibers
Meteor and many packages heavily use node-fibers. They allow you to write code as if it is synchronous, even if it is async. On the server, Meteor uses Fibers in it Promise implementation. Async functions are run within a fiber, and Promise .then functions also are.
There is some overhead to creating and destroying a fiber, so node-fibers uses a fiber pool. When
a fiber is done running, if the pool is smaller than its max size the fiber is added to the pool. When an additional fiber is needed, it reuses fibers from the pool if any are available.
If the number of active fibers in your app is frequently larger than the pool size, you can increase the pool size to allow more fibers to be reused.
const Fiber = require('fibers');

Fiber.poolSize = 200;
Mongo Connection Pool
In MongoDB, each connection to the server can only be used for one query, operation, or change stream at a time. The Node.js Mongo Driver has a pool of connections to the Mongo server to. When a connection is needed, it is checked out of the pool, and afterwards checked back in to be re-used.
The connection pool has a max size. If there are more queries than there are connections, they have to wait until there is an available connection.
If the Mongo servers are part of a replica set, the driver has a separate connection pool for each server in the replica set. Most of the metrics shown in the system dashboard are only for the pool to the primary member of the replica set.
Delays in checking out a connection increase how long queries take. Two reasons a checkout can take a long time are:
- The pool created a new connection, which is slower than re-using an existing connection. Once the connection is created, it is re-used by the pool. This is usually rare, mostly happening when the app first starts.
- There are a large number of pending checkouts. To improve this, you can try combining queries when possible, using bulk operations, or increasing the maxPoolSize option in Meteor.
The connection pool monitoring requires the useUnifiedTopology option to be enabled for the Node Mongo Driver. Meteor 2.2 and newer enable it by default.