Record CPU Profile
When your app is using a large amount of CPU, or there are large compute times in methods or publications and you don't know what is causing it, the first step is to take a cpu profile. CPU Profiles show what functions were running, how long they ran, and what called them, which can be used to know where to optimize your app to make it more efficient and faster.
Monti APM provides the montiapm:profiler package to simplify recording CPU profiles. There are three different ways to record a profile with the package:
Remote Profile
Remote profiles let you easily take a profile while your app is running in production. To take the profile:
- Go to the Tools tab for one of your apps, and click on
Take a Remote Profile - Give your profile a name, and decide how long it should run. Remote profiles have a noticeable overhead, so it is usually better to pick a shorter duration
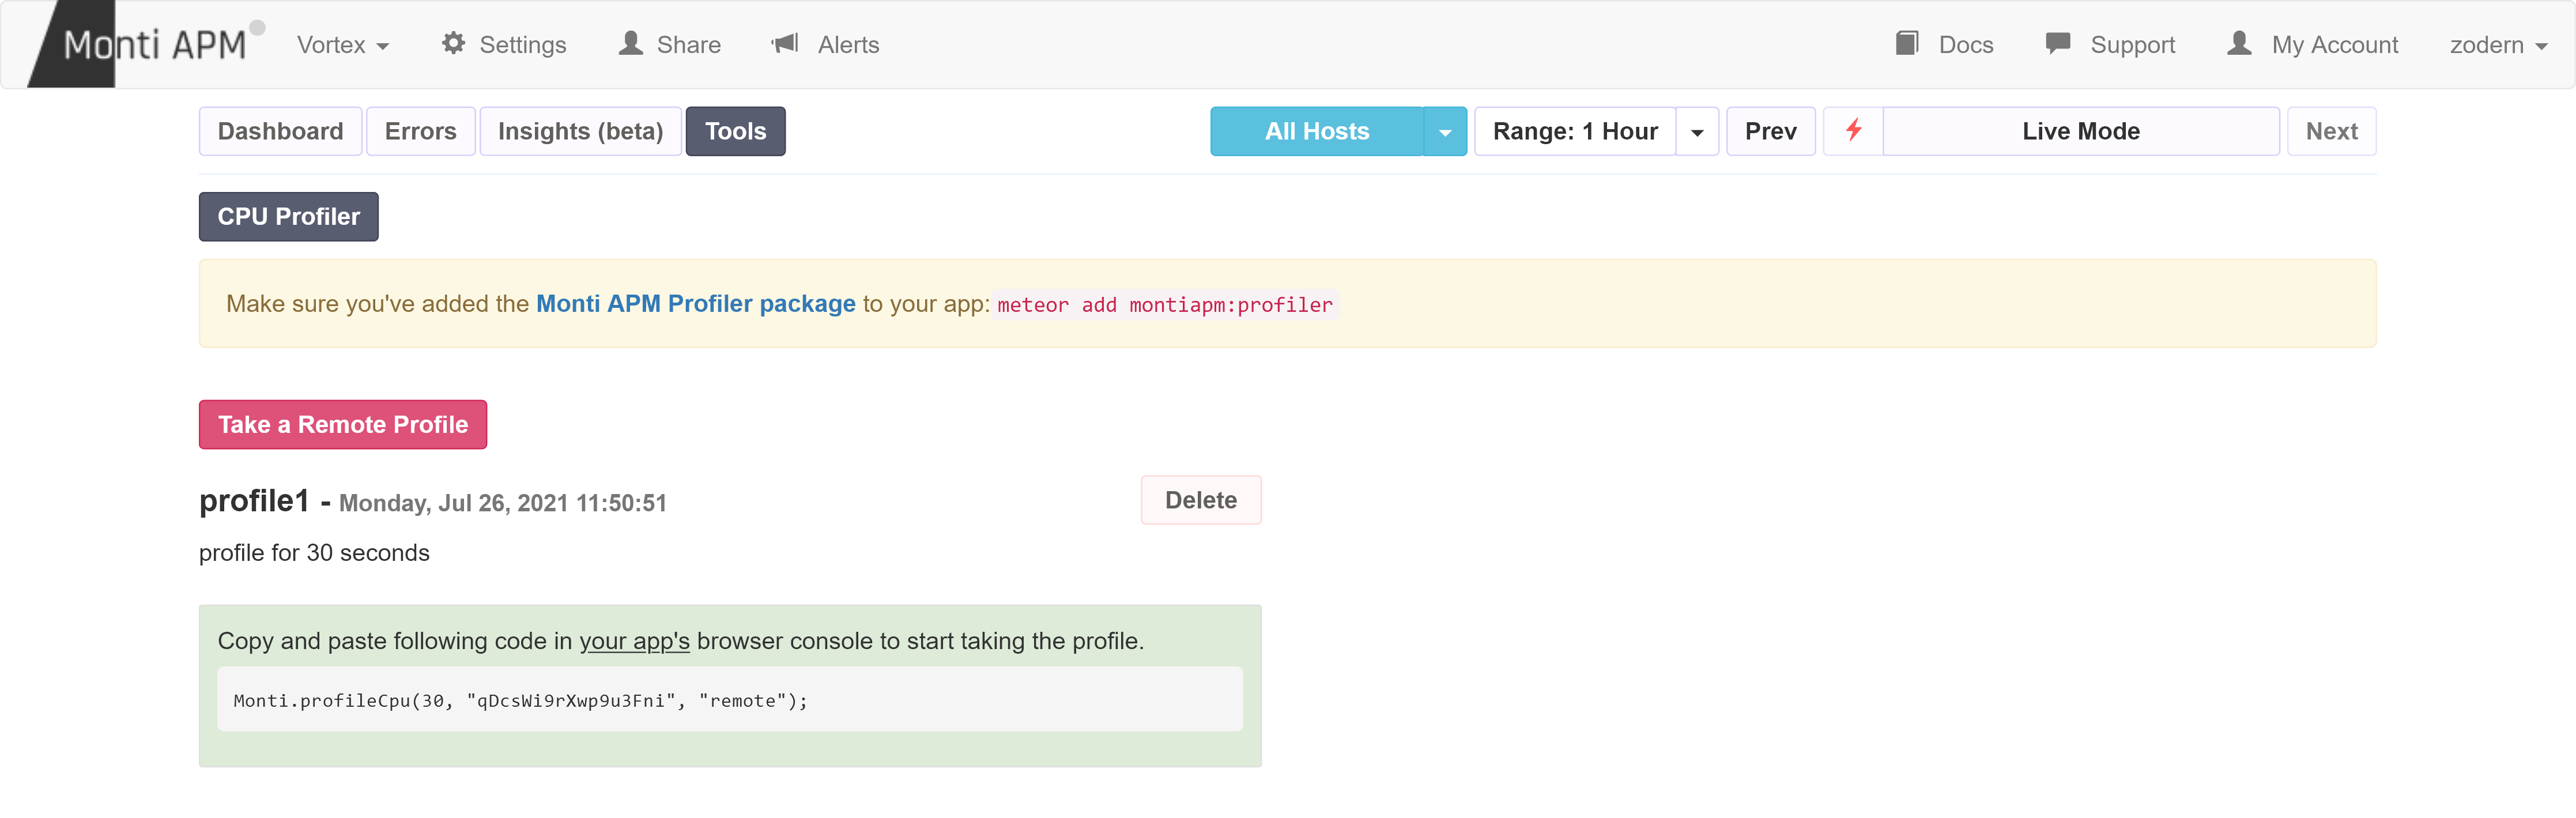
- After you click save, it will show you a command to run in the browser's console. Copy this command, go to your app, and run it in the browser's console
The profile will now be available in Monti APM to analyze.
Continuous Profiling
This feature is in beta. During the beta, it is available for both the Startup and Pro plans. After the beta, it will only be part of the Pro plan.
Instead of only taking a profile when you tell it to, continuous profiling constantly records and saves cpu profiles so you always have the information you need to investigate issues.
The continuous profiler is designed to have a low overhead, around 2% additional cpu usage.
To enable, add the montiapm:profiler package to your app, and add this to a server file:
import { Monti } from 'meteor/montiapm:agent';

if (Meteor.isProduction) {
  Monti.startContinuousProfiling();
}
After you deploy your app, Monti APM will start recording profiles. You can view them by going to the Tools tab.
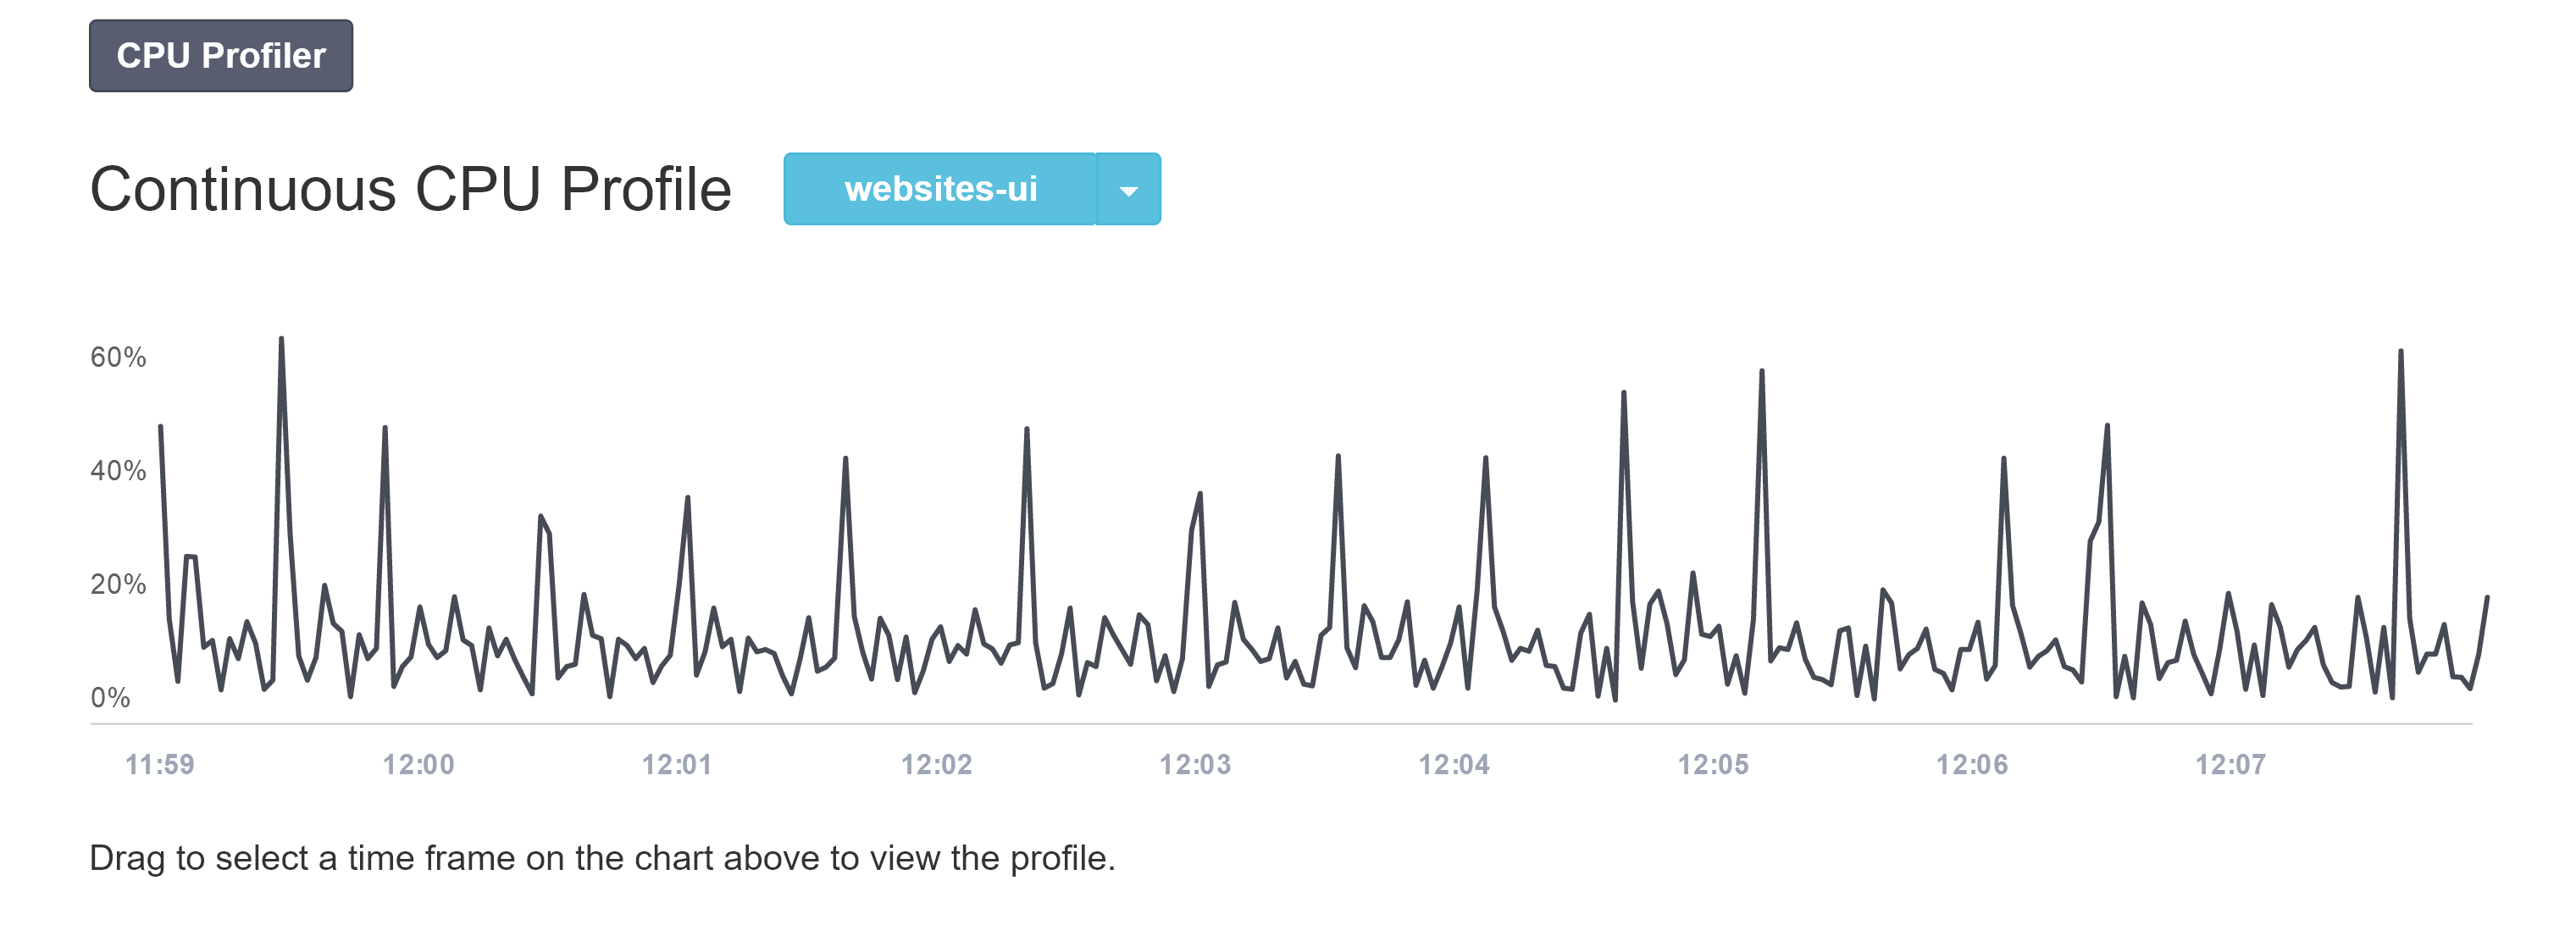
It shows a chart with the CPU usage for a host. You can use the dropdown to select a different host, or drag on the chart to select a time period.
After you select a time period, it will load the profiles and let you analyze them.
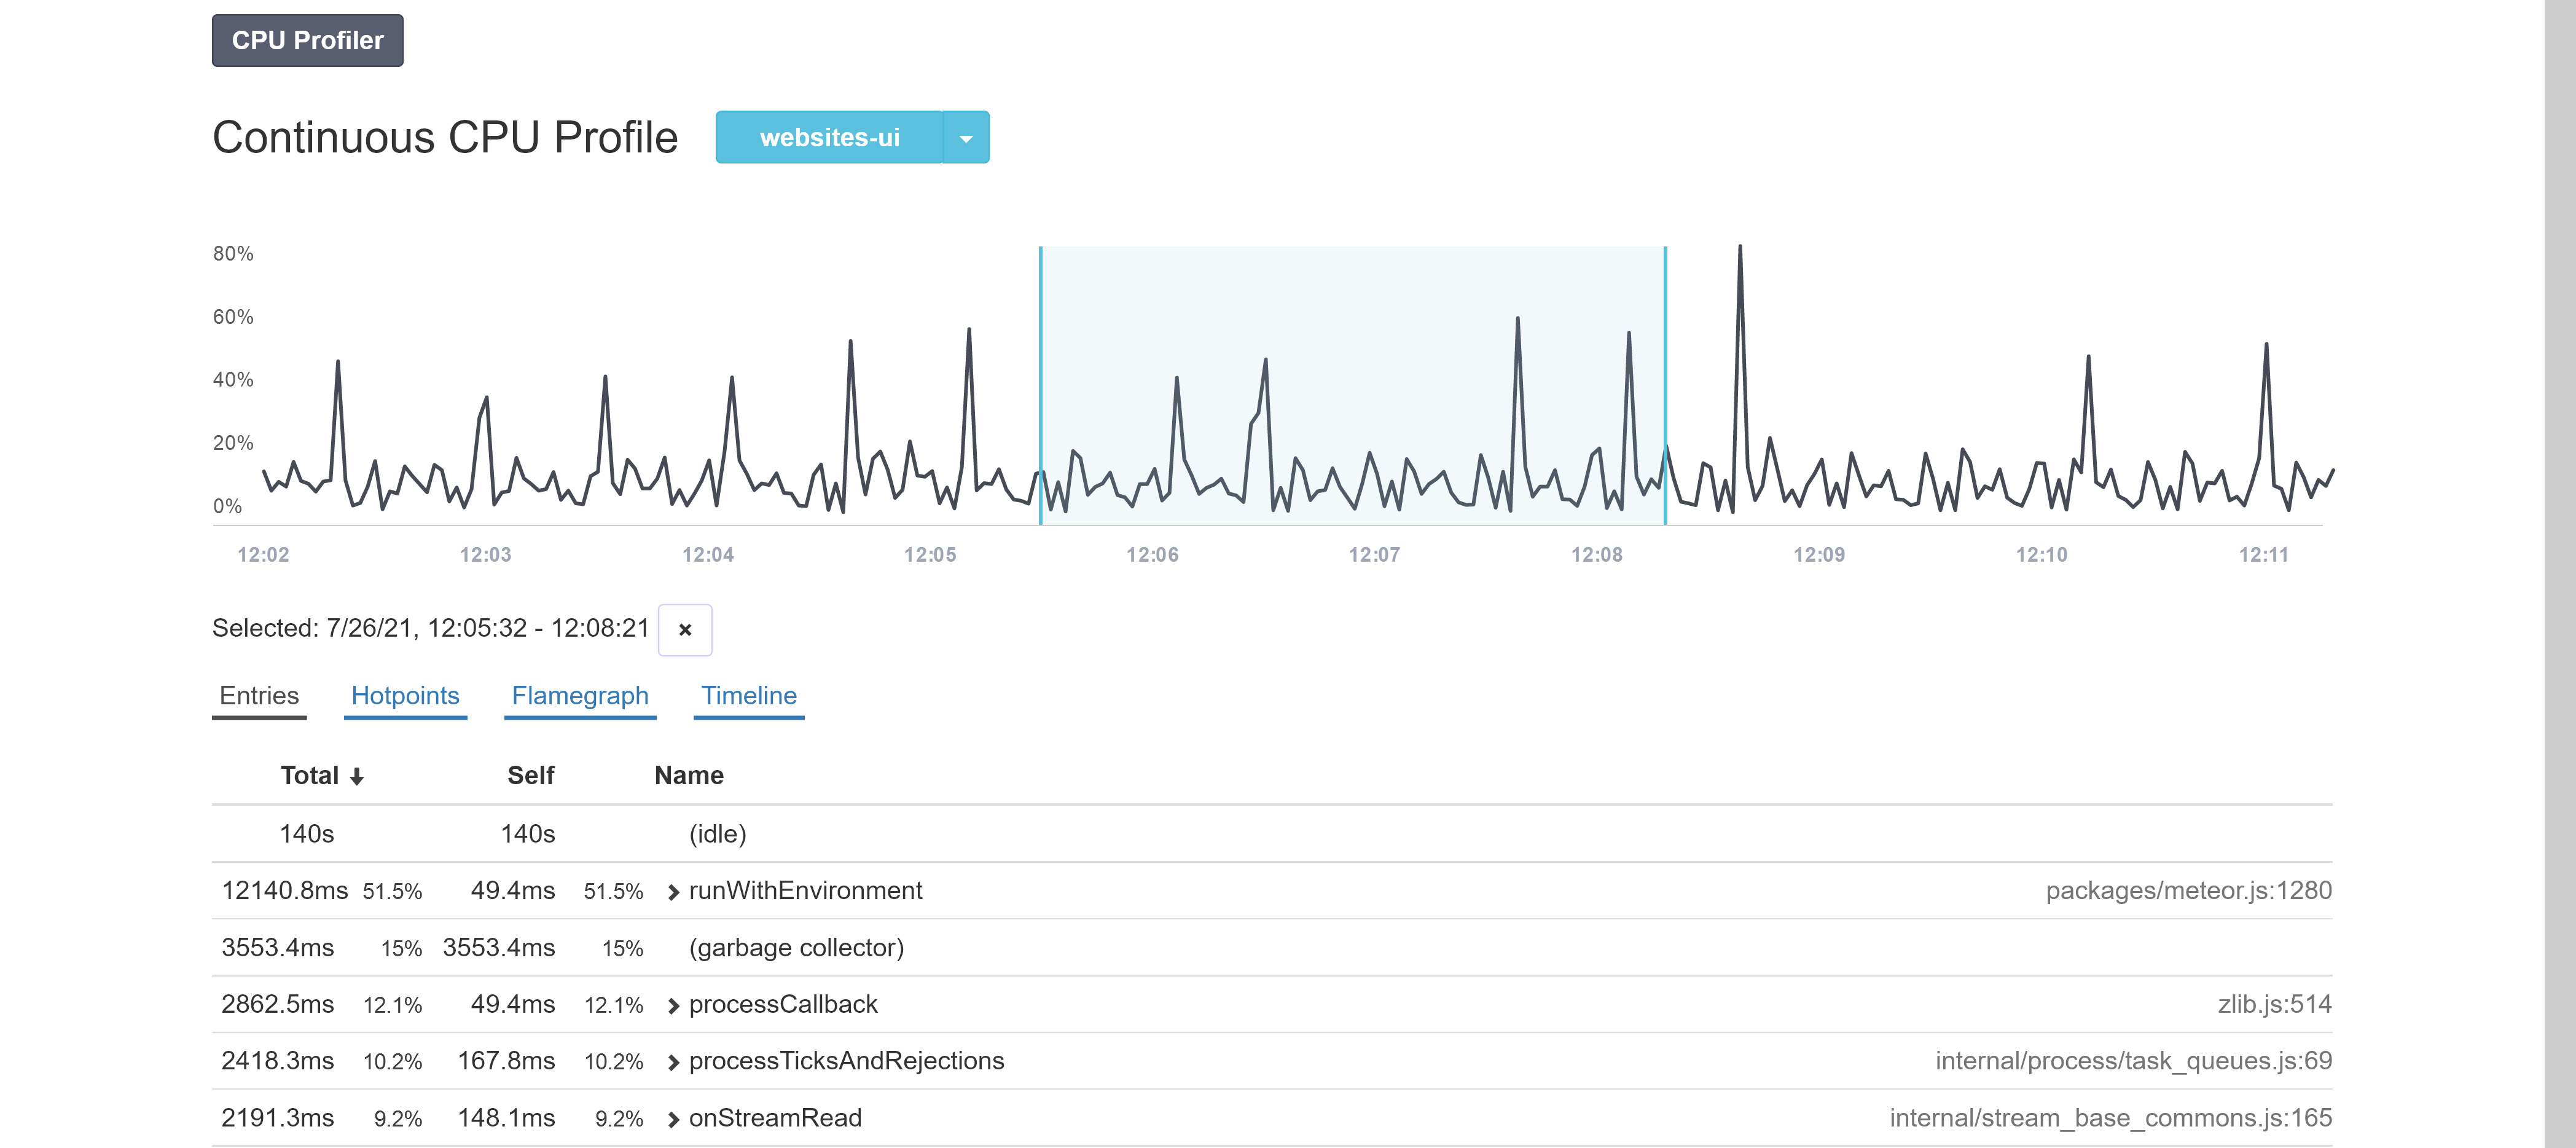
You can drag the edges of the selection to resize it, or drag the middle of the selection to move it.
Limitations
We do not recommend using continuous profiling on Windows since v8 on Windows uses a large amount of CPU while profiling.
Meteor 1.9 or newer is recommended since older versions of Node had memory leaks while profiling.
The selection is limited to a maximum of 60 minutes. We are working on increasing the limit so any range can be selected.
The v8 profiler is a sampling profiler - at a regular interval it records the current stack trace of the running function, and uses those samples to estimate how long each function ran. Continuous profilers take fewer samples to reduce their overhead, so it is less accurate when looking at very short time ranges or functions that have small self and total times.
Local Profiles
Local profiles can be taken without connecting your app to Monti APM. It is mostly useful in development, but can also be used in production if you can copy files from the server.
To enable, add the montiapm:profiler package to your app and set the MONTI_PROFILE_LOCALLY=1 env var before starting the app.
When you want to take a profile, go to your app and open the browser's console. In the console, run:
Monti.profileCpu(<seconds>)

// Example:
Monti.profileCpu(10);
The package will save the profile in the temp folder. The exact location is shown in the app's server logs.
You can then go to Monti Debug to analyze your profile.