Debugging Response Time Bottlenecks
We all want to build faster Meteor apps. Improving the server-side response time is an important factor in building fast apps.
In Monti APM, we have few tools to help you to debug response time bottlenecks in your app. I will show you how to use them.
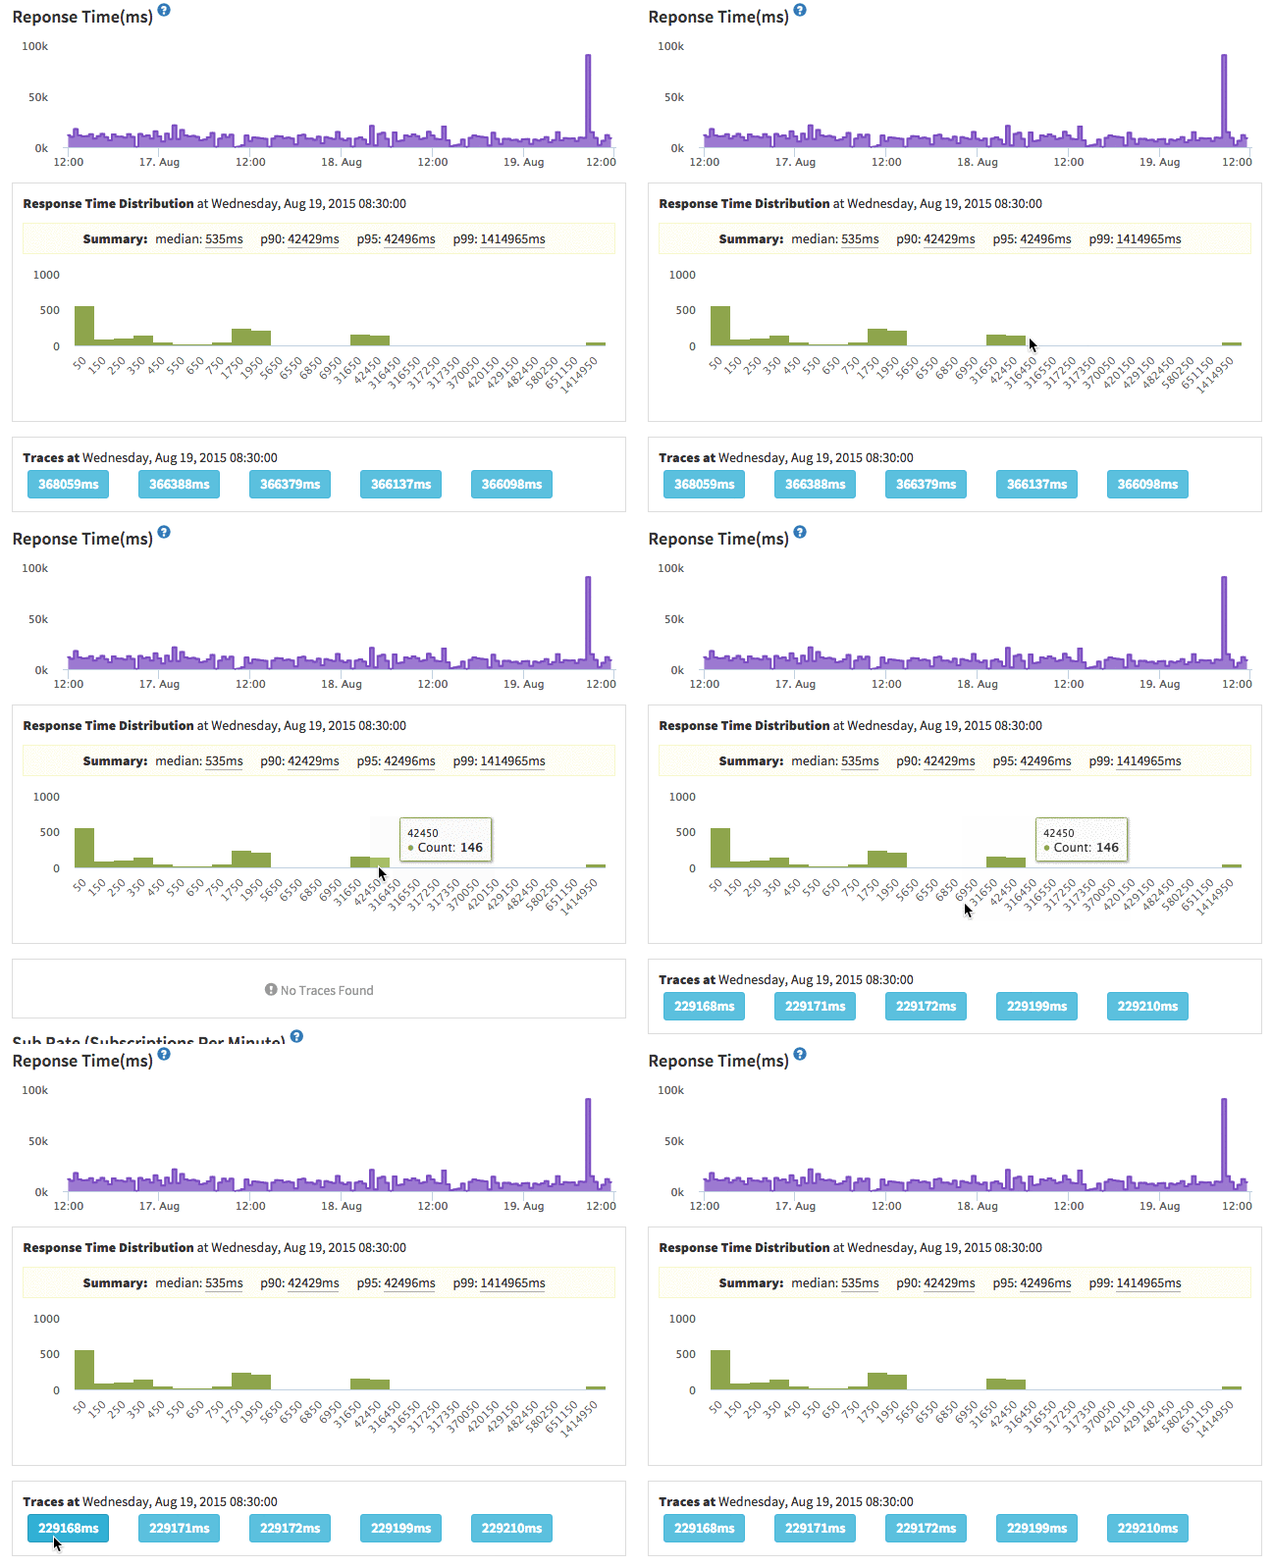
This is a case study where we debug a sudden response time increase. Look at the following graph:
We can see a spike in the response time at the end of the graph.
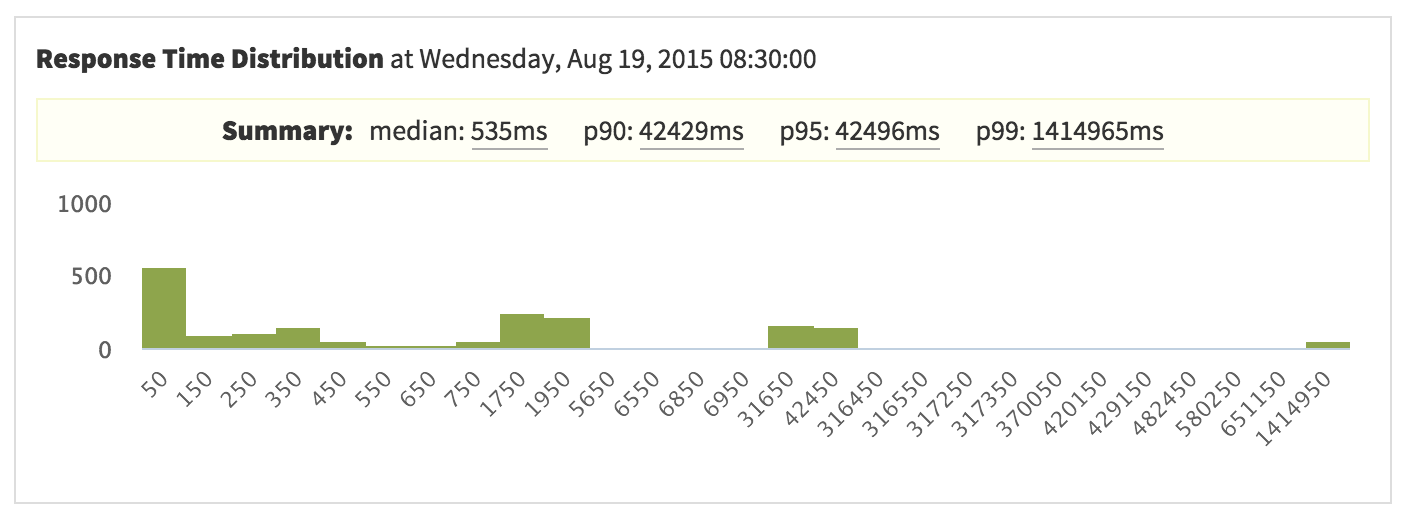
So, we can clicked on that spike. Then we'll get a response time distribution like this:
This is the response time histogram for that time. It also shows summary measurements, like median and percentiles.
If you want to refresh your knowledge about mean, histograms and percentiles, read this article.
Here, the median is about 535 milliseconds. That means 50% of our users had a response time lower than 535 milliseconds. That's good.
Have a look at the 99th percentile. It has a huge value. It seems like an outlier and a specific case.
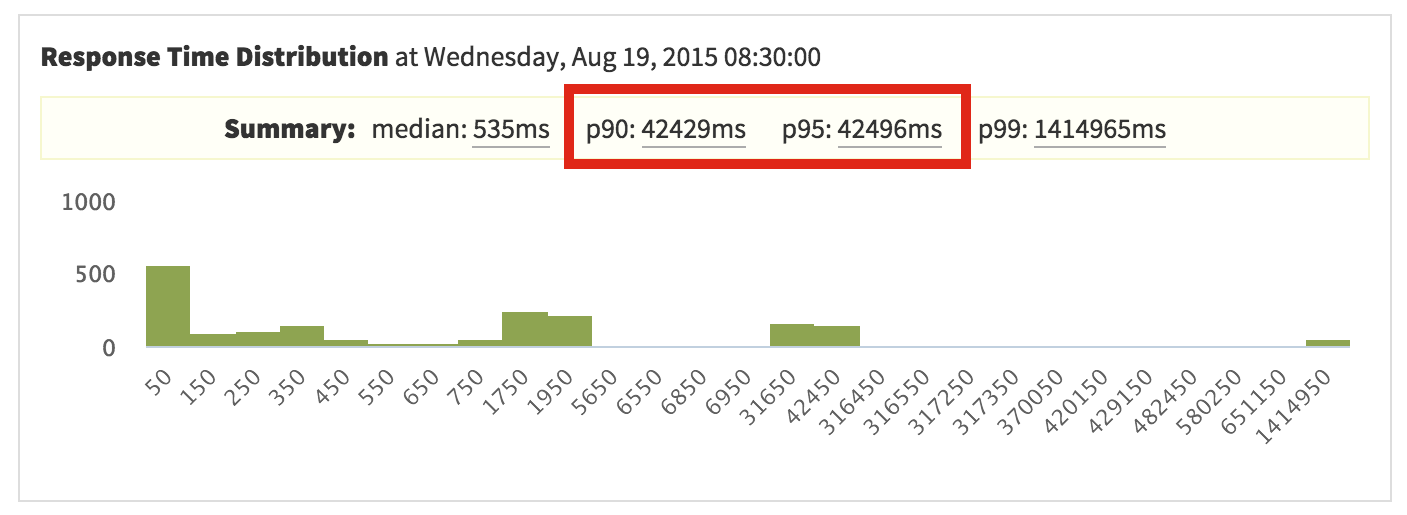
But interestingly, our 90th and 95th percentiles are also quite high. That's seems like an issue. So let's investigate:
Here our 90th percentile is 42,429 milliseconds. So we can click on the relevant bin on the histogram to see some traces:
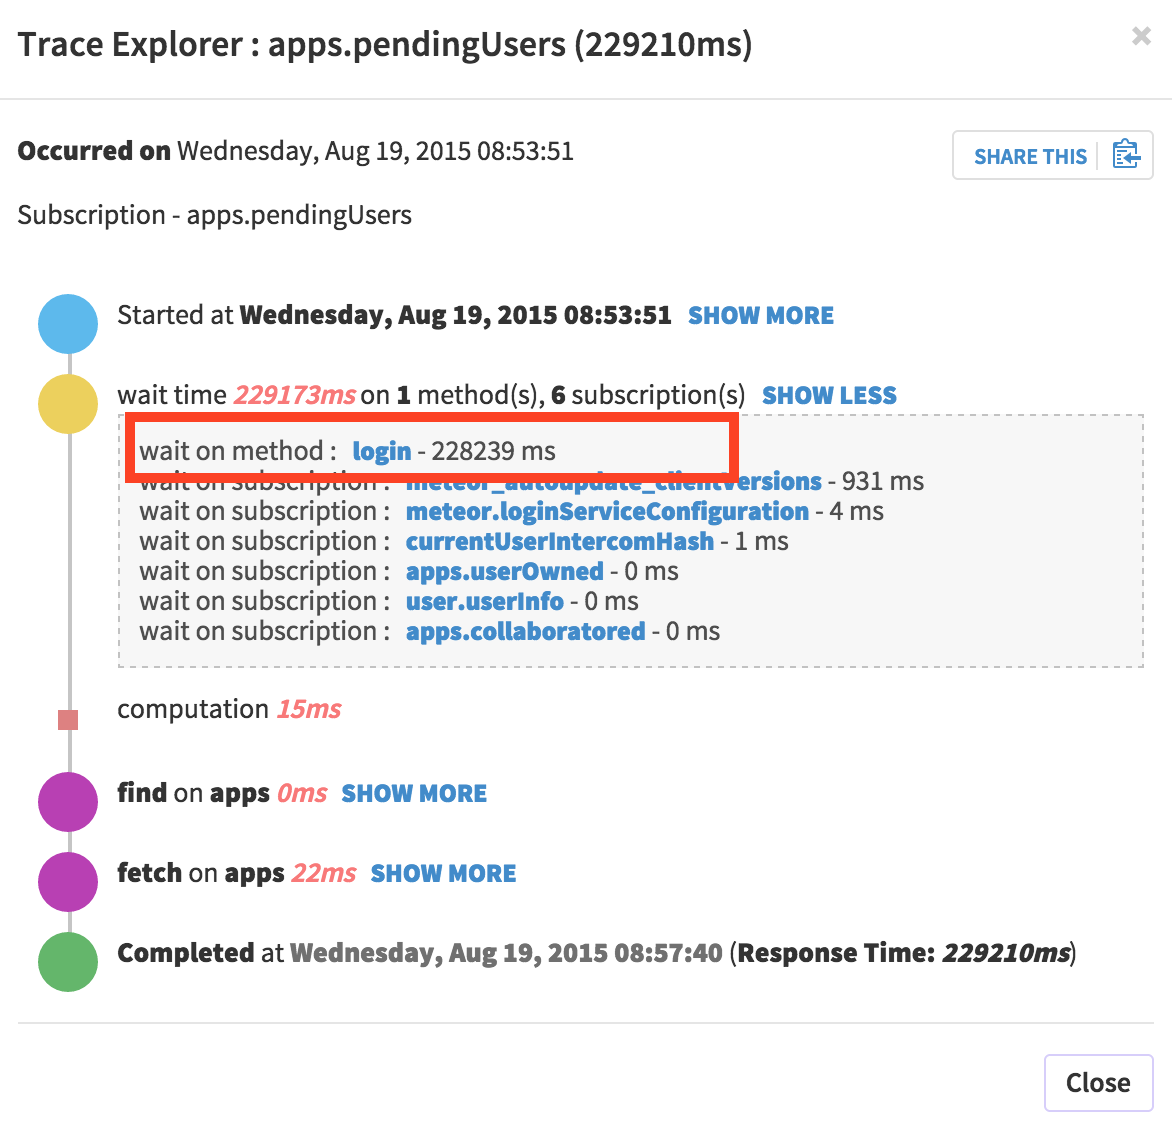
Let's look at one of those traces:
On looking at a trace, it seems like there is a waitTime issue. Actually, this happens when we re-deploy our app. All the subscriptions need to be re-run and that's why there is this issue a very big responseTime in the login method.
We can also look at the login method at that time and find out what's really happened for that as well.
This is how you can use Monti APM to debug a response time issue in your app. Depending on your app and the case, the individual steps could change slightly, but this is the process you can use.
Congratulations, you've reached the end of the Meteor Academy


