PubSub Dashboard
This dashboard shows you the performance of Meteor publications. Details on the observers created by publications is available in the Live Queries dashboard.
PubSub Summary
Pubsub Summary is a set of important performance metrics related to your publications. These are the metrics:
- Response Time - Average time spent on the server for a subscription to become ready or error
- Sub Rate - Number of new subscriptions per minute
- Active Subs (Average) - The average number of active subs per host
Average Response Time
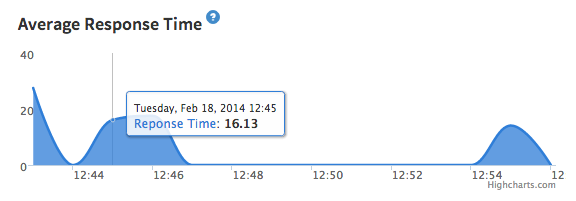
This chart shows the average response time for sending the initial data set for subscriptions. We calculate this metric when we detect this.ready() for a publication. This chart shows you whether your subscriptions are slow to process initially.
To inspect a trace of a subscription at a particular point in time, find that point on the chart and click it. You'll get a few sample publication traces you can analyze. It is impossible to send all the traces processed in your app to Monti APM so the agent picks traces for outliers (unusually slow subscriptions) to send.
By selecting a point on the chart, you can also view a detailed breakdown of the response times.
Sub Rate (Subscriptions Per Minute)
This chart shows the number of new subscriptions created each minute.
Sub Rate and Response Time
This chart combines the two previous charts so you can easily see if the numbers are correlated.
Active Subs and Average Lifetime
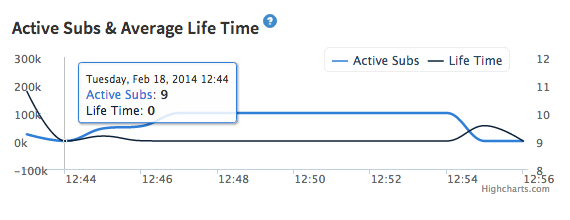
This chart shows the number of active subscriptions on the server and the average lifetime of a subscription. With this information, we can see how busy our subscriptions are in terms of quantity and lifetime.
Publication Breakdown
The Publication Breakdown allows you to sort by different values and find out how your publications work. These are the values you can sort:
- Sub Rate
- Unsub Rate
- Response Time
- Low Observer Reuse
- High Observer Reuse
- Shortest Lifespan
- Active Subs
- Created Observers
- Deleted Observers
- Reused Observers
- Total Observer Handlers
By sorting with different values, you can understand a lot about your publications. Please see these relevant Academy Articles.
- Response Time - Make your app faster
- Low Observer Reuse - Improve CPU & Network Usage
- Shortest Lifespan - Improve User Experience
- What is null(autopublish) publication?

