Understanding Your Meteor App with Monti Debug
Writing a Meteor app is fun and saves a lot of your development time compared with developing in a traditional way. Although it’s easy to write Meteor apps, there are many things happening behind the scenes. To write better apps, you need to understand what they do behind the scenes. Then you can easily optimize your app and create a nice experience for the end user.
Optimizing an app includes optimizing both the server-side code as well the client-side code. Most of the time, it’s a mix of both. So, it’s a good idea to see how the server side and client side work together.
Welcome To Monti Debug
Monti Debug is a tool that helps you to see what’s happening in your app from the perspective of a single client. It can also see what’s happening in your server as well.
It’s easy to get started with Monti Debug. This is all you have to do:
- First, install Monti Debug with:
meteor add montiapm:debug. - Then run your app. (Let's assume your app runs on port 3000)
- After that, visit https://debug.montiapm.com
- Then connect to http://localhost:3000 from the Monti Debug UI
In this guide, we’ll explore Monti Debug’s UI and how to understand Meteor apps using it. Then, we’ll show you a demo on how to use Monti Debug in a real app.
Once you have started debugging, you’ll see an interface like this:
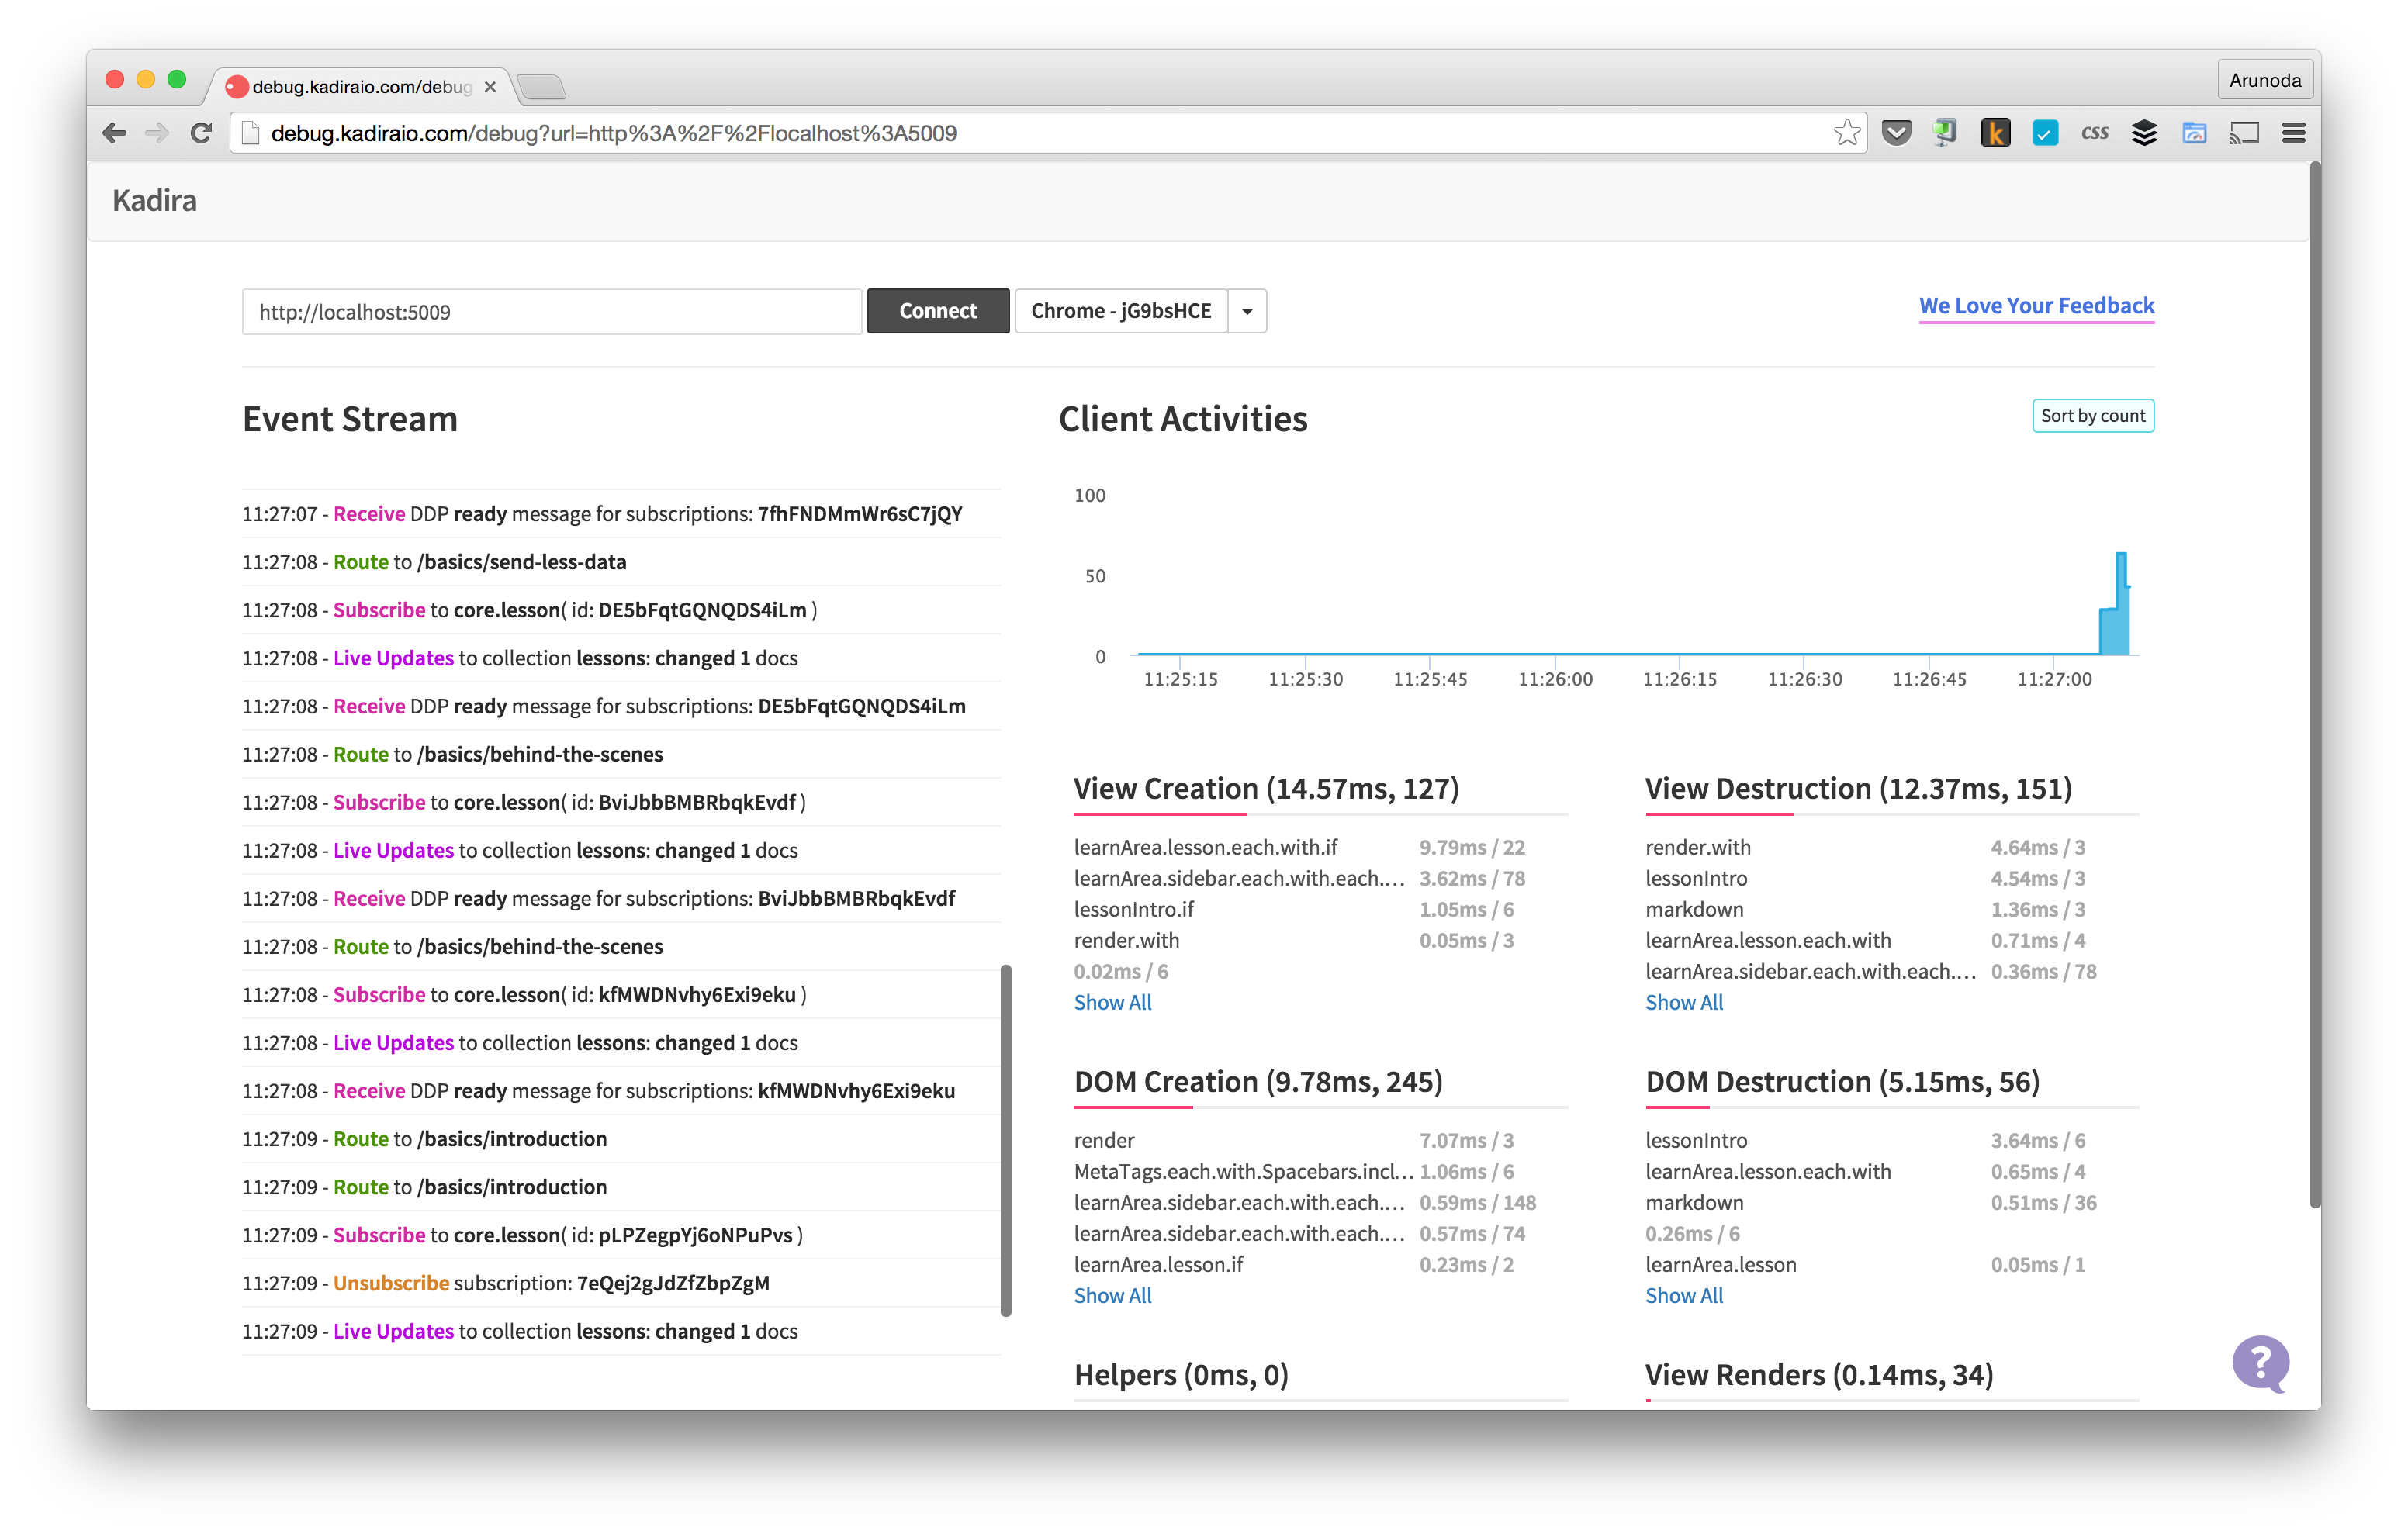
This is a unified view of what’s happening inside your app over the last couple of minutes.
Let’s look at some of these views.
Event Stream
Event Stream is the main part of Monti Debug. It shows what really happened in your app as a timeline. It includes all route changes, DDP activities, events and a few other things
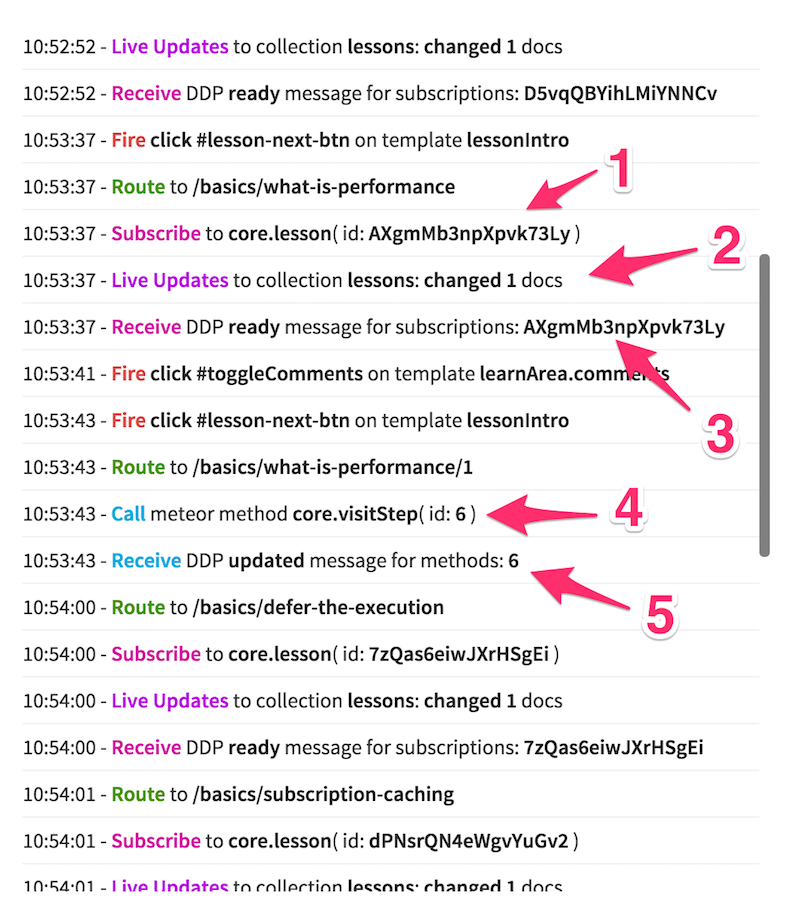
At a glance, you should be able to understand some of these events, like Route and Subscribe. But there are some events you need to look at more closely. Let’s discuss.
The bullet numbers are the numbers in the above screenshot.
- Our app subscribed to the
core.lessonpublication. That subscription has a unique ID ofAXgmMb3npXpvk73Ly. It’s generated by client-side Meteor code. - Then one of your documents in the lessons collection was changed. In Meteor, it’s not possible to identify which subscription triggered a live update. But, in this case we are pretty sure: it was the above subscription.
- Then we got a DDP message called ready for the subscription with ID
AXgmMb3npXpvk73Ly. It indicates that our subscription has sent all of the initial dataset to the client and the client can start working with the subscription data. - We called a Meteor method named
core.visitStep. Its ID is 6. - Then we got a DDP message called
updatedfor the above method. Anupdatedmessage is a core part of the DDP protocol and indicates your method has pushed all of the changed data to the clients that are watching that data. This is also used in the latency compensation. Additionally, Meteor only calls the callback for the Meteor method once it sees this message.
Client Activities
The “Client Activities” view is a very important part of Monti Debug. It shows the performance metrics for Blaze and how your app is behaving on the client side.
Monti Debug tracks a lot of Blaze related activities. Those activities show the time spent by the CPU. It groups activities into following categories.
- View Creation – This shows the time spent by the CPU calling
onCreatedcallbacks. - View Destruction – This shows the time spent by the CPU calling
onDestroyedcallbacks. - View Renders – This shows the time spent by the CPU calling
onRenderedcallbacks. - DOM Creation – This shows the time spent by the CPU creating DOM elements for Blaze views.
- DOM Destruction – This shows the time spent by the CPU destroying DOM elements related to Blaze views.
- Helpers - This shows the time spent by helpers in our app (Currently Monti Debug tracks template helpers only).
- Autoruns – This shows the time spent by autoruns in our app. Currently, we track autoruns created inside templates only.
Now that we know what are tracking in terms of Client Activities, let’s try to interpret several UI elements in the Client Activites view.
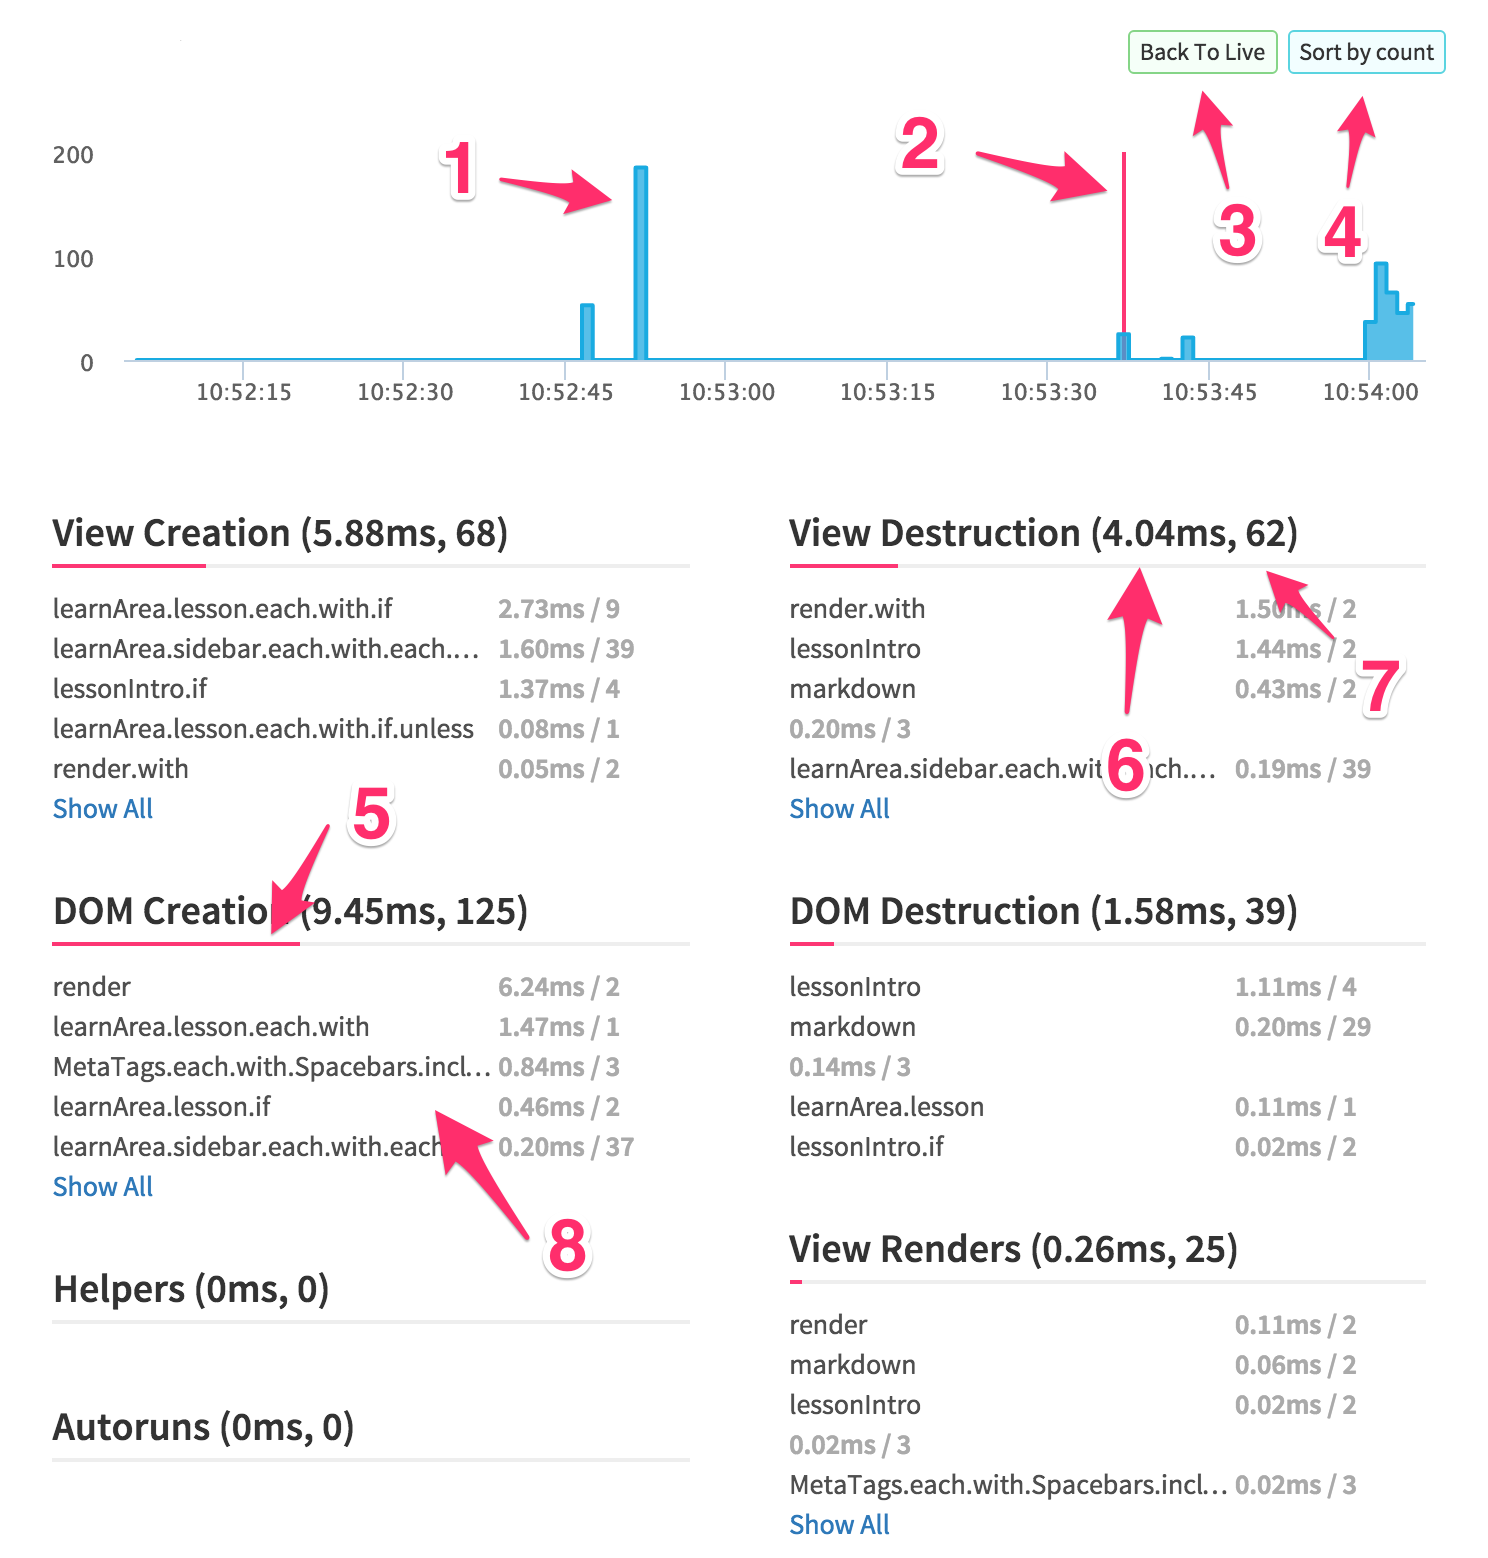
The bullet numbers are the numbers in the above screenshot.
- This is the time spent by Blaze doing stuff in that given second. Here we only track ~80% of the time Blaze spent on the CPU. According to the above chart, our app spent ~200ms of CPU time rendering our templates.
- The vertical red bar on the chart shows the selected time and the details below the chart are for that time.
- In this chart, we are looking at a specific time. Clicking on the
Back to Live buttonwill cause the live data to be shown as they arrive. - In the detailed view below the chart, individual items are sorted by
elaspedTime. This is the amount of time they were running on the CPU. But, it’s possible to sort items by the number of times they were executed. - This is a progress bar showing the percentage of time that activity group spent running on the CPU.
- This is the time that activity group spent running on the CPU.
- This is the number of activities for that activity group.
- This is a breakdown of the activities and their corresponding execution times.
Demo: Using Monti Debug
In the following demo, we are going to see how to use Monti Debug in the Discover Meteor's Microscope app and what we can improve.