Overview Dashboard
Dashboard Summary

Dashboard Summary is a set of important performance metrics for your application. These are the metrics:
- Pub/Sub Res. Time - Average time taken to process your publications in the server
- Method Res. Time - Average time taken to process your methods in the server
- Memory Usage/Host - Average memory usage of all of your hosts, based on the RSS size.
- CPU Usage - Average cpu usage of all your hosts
- Sessions/Host - Shows the average number of sessions per host
Memory Usage/Host (MB)
This charts shows the average memory usage across all the hosts in the given time range. We use RSS as the memory usage, which represents the amount of physical memory usage by the process. More detailed memory metrics are available in the system dashboard.
CPU Usage
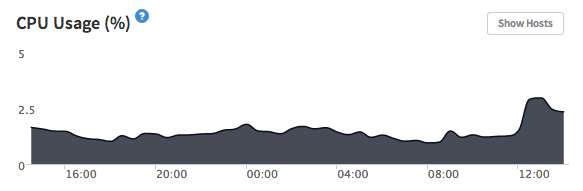
This charts shows the CPU usage in percentage of your app. Each core represents 100%, so if your app is fully using two cores the usage would be 200%.
Total Sessions
This chart shows the number of active sessions in the given time range.
Active Subscription
This chart shows the average number of subscriptions for a host across all hosts in the given time range.
New Observers
This chart shows the number of new Observers initiated in the given time range.
Meteor is able to reuse observers for identical cursors. The chart does not show reused observers and instead shows the actual number of observers created.
This content originally appeared in the Kadira Knowledge Base.