Methods Dashboard
This dashboard shows the performance of Meteor Methods in your app.
Methods Summary

Methods Summary shows the summary of the method in the selected date range. If a method is selected, then the summary will be for that specific method. Otherwise, it summarizes all of the methods.
Here is a list of the metrics shown in the widget:
- Response Time - The average response time per method, in milliseconds
- Throughput - The number of method calls received per minute
- Total Methods - Total number of method calls received, including errors
Response Time Breakdown with Traces
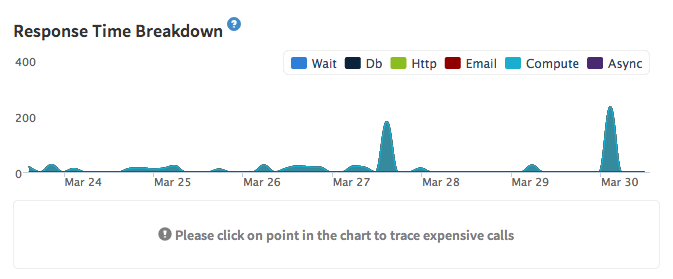
Response Time Breakdown shows the response time, broken down by how much time was spent in different categories:
- db - Time spent on database activities, including read and write operations.
- http - Time spent waiting on HTTP requests
- compute - Time spent on CPU-intensive tasks inside a method (e.g. time spent sorting and calculating a value).
- async - Time spent on async activities, especially with NPM modules.
- email - Time spent sending emails.
- wait - Time the method spent waiting to be processed. This metric is important because methods from a single client are processed sequentially, and so a method can sometimes idle in the queue waiting for earlier methods to finish.
Additionally, if you like to inspect a trace of a method call at a particular point, find that point on the chart and click it. You'll get a few sample method traces that you can analyze.
Throughput (Requests Per Minute)
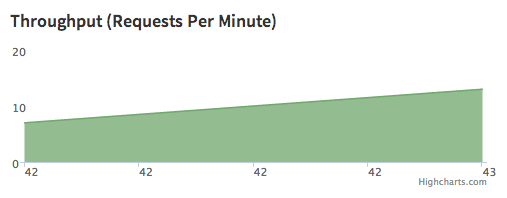
This chart shows the number of method calls per minute.
Average Response Time
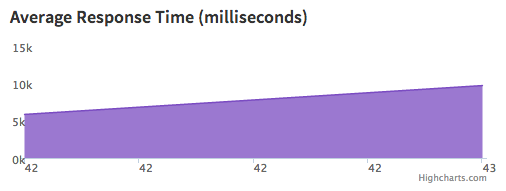
The chart above shows the average response time for method calls in milliseconds for the selected date range
Error Rate
This chart shows the percentage of method calls that errored.
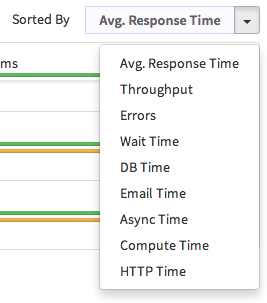
Method Breakdown
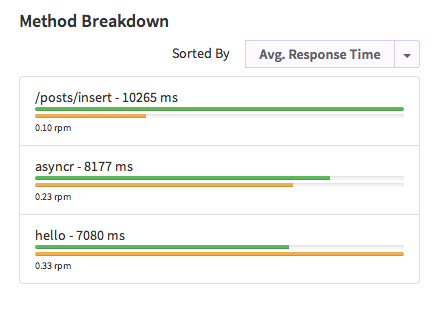
This chart allows you to drill down into the methods. It shows a list of methods sorted by a metric, which can be selected on top. In the chart above, methods have been sorted by average response time. Options for sorting are shown below.
For each method, two progress bars are shown. The green progress bar represents the sorted metric, while the orange bar represents the throughput of the metric. Sometimes, even though the metric value is high, it may not have a considerable amount of throughput. The throughput bar on this chart enables you to detect that situation.
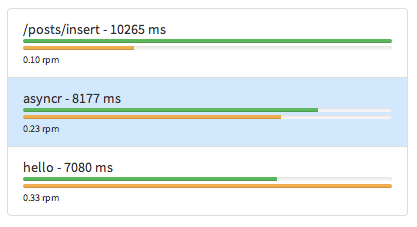
Another feature of this chart is the ability to select the method. Once you have selected a method, all the other graphs will show data corresponding to the selected method.
Trace Explorer
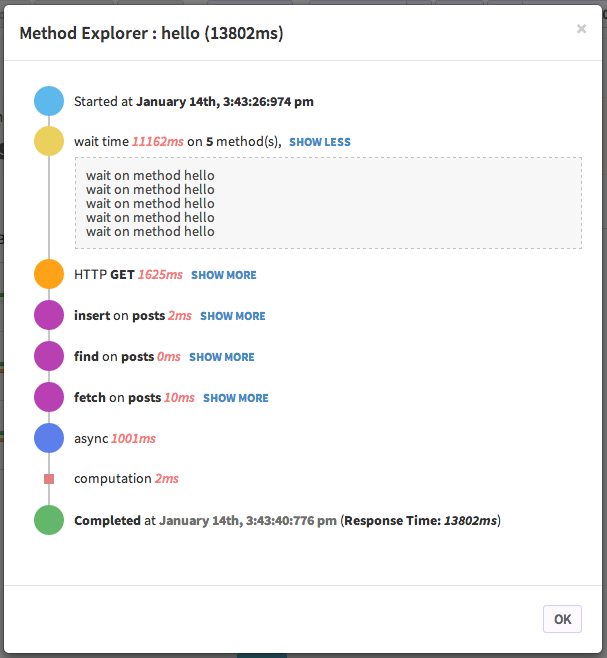
The trace explorer is a core feature of Monti APM. It shows you graphically what happened in a specific method call. It can be used to identify problems and find solutions easily. You might think of it as a graphical stack trace for a Meteor method.
In the example above, Method Explorer is showing a method call to the `hello`` method that took 13,803ms to complete. The call waited in the queue for 11,162ms while five other methods were being processed.
The example also shows a HTTP GET request with 1,625ms, as well as some other DB operations.
This content originally appeared in the Kadira Knowledge Base.