Optimize Memory Usage
This article is out of date
Caching data on the server is one of the common issues with Meteor. I have also claimed that it is one of the core issues for Meteor.
So, I recently started writing a package called light-cursors, which prevents documents being cached on the server. But when I started to test it, I found something very interesting.
V8 Caches Objects
V8 is the JavaScript engine behind nodejs. V8 caches similar objects regardless of where they are and how they've been created. For example, let's look at this:
var arr = [];
var str = getString(5000);
var obj = {data: str};

for(var lc=0; lc<2000; lc++) {
  // Simulating that we got data over the network
  var newData = JSON.parse(JSON.stringify(obj));

  // Now, it's not the same object
  newData.anotherField = Math.random();

  arr.push(newData);
}

function getString(length) {
  var str = "";
  for(var lc=0; lc<length; lc++) {
    str+= "" + Math.ceil(Math.random() * 9);
  }
  return str;
}
Although, there are 2000 objects, memory wise it's a single object. That's because there are only one strings shared between all these docs. So, this only tooks around 26 MB of data from the Memory.
Look at this code:
var arr = [];

for(var lc=0; lc<2000; lc++) {
  // an object with unique string
  var newData = {data: getSting(5000)};
  arr.push(newData);
}
This time each string is different and they are allocated memory correspondingly. Because of that above tooks around 420 MB of data from the Memory.
See this Gist for how to do these tests yourself.
How This Affects Meteor
Whilst it depends on each set of particular circumstances, overall we can live with how Meteor caches data. Meteor caches each document that has been sent to the client in server memory. But with v8 object caching, we don’t need to worry about the actual memory usage much. See the following examples.
Let's say you have one big subscription with 100 docs and it has 1000 client subscriptions. Meteor caches 100 × 1000 documents in memory. But, actual memory consumption is only about the size of one subscription (100 docs). The exact amount of memory used may be slightly different.
However, if you have 1000 different subscriptions instead of one, there is a chance you'll have a memory issue. If your documents share the same underlying v8 objects (including strings and numbers), then you'll have no issues, but it's totally dependent on your app.
Also, v8 hashes all the object keys and they are also get cached. So, you don’t need worry about keys in your documents at all.
Tracking Memory Usage with Monti APM
Using Monti APM, we would like to tell you the exact amount of memory used by your app. But we don't want to spend a lot of CPU cycles doing so. So, we have implemented a way to detect memory issues without spending too many CPU cycles from your app. However, it calculates an estimated value. It is not 100% accurate, but it tells you if you need to take any action or not.
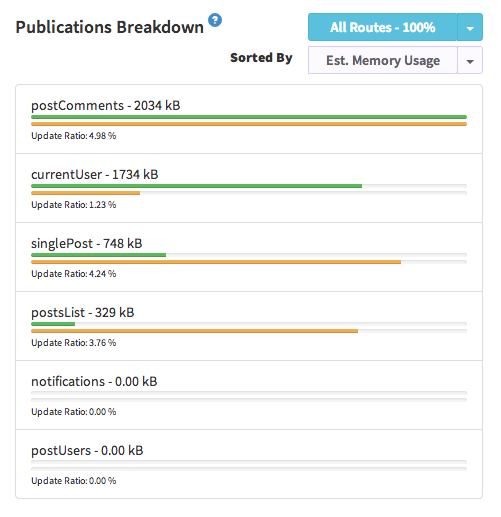
We name this metric as "Estimated Memory Usage", which is an estimated value for the memory stored on RAM for a publication. How we calculate it can be found here.
You can sort your publication by "Est. Memory Usage" as follows.
If you've a high value for "Est. Memory Usage", you can do several things.
- If your publication's "Observer Reuse" value is pretty low, try to increase it. Follow this guide.
- If your publication's "Update Ratio" is pretty low, try to use a method instead.
There are several other ways you can send documents to the client. Refer this meteor-talk discussion for more information.
If you follow the second approach and have high throughput, you will still have high MongoDB usage. This is last thing you should try, unless you can't increase the Observer Reuse.
